Anne and I just got back from a road trip to California to visit some of our grandkids. We had a great time, but the trip showed me just how misguided some of our Green Energy Policies have become. All energy in California is artificially expensive because of surcharges on electricity, special refinery charges, and the 60.6 cents per gallon tax on fossil fuels. As a fact gasoline in California was almost exactly one dollar per gallon more expensive than the same gasoline in Oregon and Washington state. What do Californians get for their politically imposed reduction in their standard of living? As far as I can tell; periodic electrical brownouts and some of the worst traffic jams I’ve experienced in years. I am not yet ready to call California a failed state, but someone must start looking out for the working families there and quit sacrificing the middle class for the utopian goal of zero carbon emissions. I’ll try and explain my thoughts in the section that follows. Much of this material flows from my analyses documented in my May 17th, May 23rd, and May 30th Notes.
Is Global Warming a Planetary Disaster or a Political Control Battle?
As you know I have been supporting the Idea of Global Warming for some time but recently I have been put off by elements of the “Green Revolution” which make little or no sense with respect to actually solving the root problems causing Global Warming. The root problem with respect to Global Warming is too many people burning too much fossil fuels in order to support and/or improve their standard of living. Any argument with that? The obvious solutions are to 1) reduce the number people, and 2) find alternate energy sources not involving the burning of fossil fuels. The obvious third solution is to reduce carbon emissions by reducing the standard of living for selected peoples by reducing their transportation capabilities, which appears to be the approach practiced in California, but I am not a supporter.
Since Global Warming is a multi-generational problem, despite what Greta Thunberg says, we can reasonably reduce the population by decreasing Human Fertility as discussed in my May 23rd notes. Even though trending shows human population will start decreasing about 2075 the reduction will not be significant enough to solve the Global Warming problem. Therefore, how does the Green Revolution propose to solve the problem? And how do I propose to solve it?
The main exponent in the Green Revolution is penalizing the consumption of fossil fuels by forbidding oil exploration, cancelling pipelines, and penalizing refineries and coal miners. This raises the price of fossil fuels and in theory makes renewable energy sources more attractive to the public power companies. This worked when renewable energy sources were new and untried, but now the market for renewable energy is well established in places like California, and the real need is for non-fossil-burning standby power. Remember solar and wind powerplants can only provide 20% to 35% of their rated power over time because clouds, nighttime, and lack of wind, so either huge (and expensive) energy storage facilities must be built, or roughly 65% to 80% of the total power requirements must be met with hydroelectric, geothermal, or nuclear powerplants. Unfortunately, the Green Revolution seems to have totally overlooked this requirement. To further explain this issue, I have included the Estimated Total California Energy Consumption in 2018 in figure 1 below.

Figure 1 Breakdown of the Estimated California Energy Consumption in the year 2018.
Looking at the percentage of electricity generated by solar and wind power above we get 31% in 2018 and later data indicates that 36% of retail electric power was generated by renewables in 2020. So, we’re right on schedule for electricity generation and all we have to do is replace the 635 trillion BTUs/year generated by natural gas with 41 GW worth of nuclear powerplants and California electricity generation will be fossil free. Note that 35% of the net electric generated was power imported from out of state and hence is carbon free by definition. Unfortunately, that still leaves residential and commercial heating, industrial power, and transportation as major problems. No one said this would be easy. California has banned the installation of natural gas in new home construction which will add another 29 GW of nuclear powerplants. Banning natural gas for heating commercial properties would only add another 17 GW of nuclear powerplants. The industrial use of natural gas is for both power and heating and electricity is not a one for one replacement. Neither I nor the Green Revolution have an easy fix for fossil-fuel-free industry, but I have to believe that small (500 MW) factory-built nuclear powerplants on site at industrial facilities could provide the necessary heat and electricity for manufacturing. Recent advances in generation IV reactor technologies would make this economically viable.
The Green Revolution is pushing Electric Vehicles (EVS) as the answer for transportation. This is a reasonable solution if you have already gone fossil-free with respect to electrical generation. Unfortunately, if you are still burning fossil-fuels to generate electricity the energy losses inherent with generating the electricity, transmitting the electricity over powerlines, and charging and discharging the batteries are actually more than the energy losses in burning the fossil-fuels directly in the car or truck. It is imperative to achieve fossil-free electricity before the major switch to electric vehicles, or you are going to increase net carbon emissions. Norway got this right and has almost entirely fossil-free electrical generation while they sell more EVs than fossil-fueled cars.
The bottom line is that California (and the U.S. in general) has got to embrace more than wind and solar energy to have any hope of eliminating carbon emissions, and I see no signs that this is happening. Nuclear power is one option but the Diablo Canyon Powerplant in San Luis Obispo County is currently the only major nuclear Powerplant in California with a rated power generation capacity of 2.256 GW. It is scheduled to go out of service in 2023. As a side note, California does have a 2 GW nuclear powerplant under construction in the Westland Solar Park in Kings County, California. It is scheduled for completion in 2025, and it is obviously designed as backup power at night for the 2 GW of solar panels. Someone got this one right.
To replace the petroleum products burned in California in 2018 with electricity to power the replacement EVs they will need an additional 242 GW of nuclear powerplants. This is more than two orders of magnitude increase from current availability and must be ready by 2035 since California Gov. Gavin Newsom signed an executive order requiring all new passenger vehicles sold in the state to be zero-emission by 2035. This makes absolutely no sense, especially since most EVs charge at night when solar power is not available. My prediction is that California will continue to lead the nation in renewable energy installations and build some nuclear powerplants, but that they will also continue to upgrade and improve their natural gas-fired powerplants to prevent brownouts and keep their EVs charged. While they can claim they are green they are really continuing to emit Carbon Dioxide and actually increasing those emissions with every gas-powered vehicle they replace with an electric vehicle.
As you can see, the largest compliant I have with the Green Revolution is their rejection of nuclear power. There is absolutely no way for the United States to eliminate fossil-fuels without nuclear power (we do not have the major hydro and wind power sites that Norway does). Therefore, the Green Revolution coalition should be massively funding bleeding-edge nuclear reactor technology. But they are not. There are significant advances in low-cost nuclear powerplant technology on the horizon as I documented in last week’s Notes (May 30th). Unfortunately, without a commitment by the Green Revolution to developing a Generation IV nuclear-powerplant, I see the current GW effort as a slow-motion train-wreck with reductions in our standard of living amongst intermittent brownouts.
My question is: is this just poor planning, or a clever move to secure political power?
I say that because we have a well-known quote in this country, “Never waste a good crisis”, and this one certainly hasn’t been wasted. We are being told we need to reach international agreements on elimination of fossil-fuels this year or it will be too late (quote from chair of the current G7 meeting). I’m not sure where the panic comes from since the Earth’s average sea level is only up 8 inches in the last century and nobody has yet embraced the abundant technologies available to solve the problem that I have covered over the last month of Notes.
To emphasize my implication that Global Warming (GW) is a political tool I’m enclosing the following instructions from a GW web site.
“There is no one-size-fits-all approach to stopping or slowing global warming, and each individual, business, municipal, state, tribal, and federal entity must weigh their options in light of their own unique set of circumstances. Experts say it is likely many strategies working together will be needed. Generally speaking, here are some examples of mitigation strategies we can use to slow or stop the human-caused global warming (learn more):
Where possible, we can switch to renewable sources of energy (such as solar and wind energy) to power our homes and buildings, thus emitting far less heat-trapping gases into the atmosphere.
Where feasible, we can drive electric vehicles instead of those that burn fossil fuels; or we can use mass transit instead of driving our own cars.
Where affordable, we can conserve energy by better insulating our homes and buildings, and by replacing old, failing appliances with more energy-efficient models.
Where practicable, we can counterbalance our annual carbon dioxide emissions by investing in commercial services that draw down an equal amount of carbon out of the atmosphere, such as through planting trees or carbon capture and storage techniques.
Where practical, we can support more local businesses that use and promote sustainable, climate-smart practices such as those listed above.
We can consider placing an upper limit on the amount of carbon dioxide we will allow ourselves to emit into the atmosphere within a given timeframe.”
These are “feel-good” efforts and are not going to seriously reduce the world’s CO2 emissions, especially since the U.S. and Europe together only account for 30% of the world’s total CO2 emissions. The real way to fight GW is to develop and make available to the world cost-effective, factory-built, Generation IV, nuclear powerplants. That would end the burning of fossil-fuels within a generation, but you will not find that in the current GW or G7 agenda. The G7 seems to believe that you can eliminate fossil fuels by embracing only renewable energies. My use of California as an example shows why that strategy won’t work. However, it seems to be a good political strategy.
In summary, I have tried to explain why current world efforts with respect to Global Warming seem to be more of a political strategy than a serious effort to eliminate CO2 emissions. There are numerous technologies available to replace petroleum in transportation (e.g., ammonia generation at renewables sites covered in May 23rd Notes), to cool the Earth by injection aerosols at high altitudes, and to replace power generation in the third world with Generation IV nuclear powerplants (May 30th Notes), but these efforts are actively being fought by the people leading the political efforts with respect to GW. Why is that?
Possible infinite supply of Lithium
I ran across this technical article on extracting lithium from seawater. It involves a cleverly designed membrane with holes just big enough to pass the lithium ions in solution. This allows the system to concentrate the lithium from 0.2 ppm in Seawater to 9000 ppm in the solution after five passes through membrane layers. The byproducts of the system are hydrogen gas and chlorine gas which can be sold to pay for the process.
I am including it to show the impacts advanced technology can have solutions to Global Warming. It is quite technical so reading it is optional.

Fig. 1 Setup of the continuous electrical pumping membrane process. (a) Schematic illustration of the three-compartment electrical cell to continuously enrich lithium from the feed solution to the cathode compartment and simultaneously generate H2 and Cl2 at the cathode and anode, respectively; (b) photographic image showing the enrichment setup; (c) the crystal structure of LLTO in ball-and-stick mode; (d) illustration of the percolation of lithium ions in the LLTO lattice; (e) images showing the glass-type LLTO membrane (∼20 mm in diameter); (f) images showing the copper hollow fiber cathode, which is coated by catalytic Pt/Ru (dark color) at one end.
LLTO is one of the superior solid-state lithium-ion superconductors. Its high lithium-ion conductivity and high selectivity to other ions can be explained from its crystal structure. LLTO has a perovskite-type crystal structure as illustrated in Fig. 1c.25–28 The crystal structure of the LLTO membrane was confirmed by XRD (Fig. S4, ESI†). The lattice framework of LLTO consists of interconnected TiO6 octahedra forming cubic cages that accommodate Li+ and La3+. The large La3+ ions act as support pillars to stabilize the crystal structure. The high valency of La3+ causes an alternative arrangement of La-rich layers and La-poor layers along the c-axis and generates abundant vacancies in the structure that allow intercalation of Li+. The transport of Li+ from one cage to the others needs to pass through a square window of 1.07 Å that is defined by four neighboring TiO6 tetrahedra. The size of Li+ (1.18 Å) is slightly bigger,29–31 which requires a slight distortion in framework to enlarge the windows (Fig. 1d) and this is possible due to thermal vibrations of the TiO6 octahedra. Other ions present in seawater (i.e., Na+, K+, Mg2+, Ca2+, etc.) are much larger than lithium ion, which requires a substantial larger distortion and thus a much higher energy barrier to transport.3,15,23,24Hence, from the property of LLTO we expect that the LLTO membrane will allow fast transport of Li+ but blocks all other major ions present in seawater.
The feed compartment and the anode compartment were separated by an anion exchange membrane (AEM) that allows the transport of anions only. The anode was a standard Pt–Ru electrode, but a metallic copper hollow fiber (Cu HF) was used as the cathode (Fig. 1f), which was further coated with 2.0 mg cm−2 Pt–Ru (Fig. S5, ESI†) to facilitate the hydrogen-evolution reaction. The copper hollow fiber had a standard finger-like porous structure,32 allowing CO2to be introduced from the inner channel and be blown out through the porous wall, to ultimately be released uniformly into the cathode compartment. The released CO2 created an acidic environment near the cathode, which, as previously reported,33 enhances the faradaic efficiency at high current densities. Concentrated H3PO4 was further used as an auxiliary solution to control the pH, whereby CO2 and H3PO4 form a buffer solution to maintain the pH of the cathode compartment between 4.5 and 5.5 to protect the LLTO membrane from alkaline corrosion.
The feed stream was circulated between the feed compartment and a large volume feed tank (Fig. 1b). The cathode stream was also circulated through a micropump, but the volume was much smaller than that of the feed stream to ensure a stage-cut <5%, and thus maintain an almost constant feed concentration (within 5% deviation based on mass balance) during the entire process. The anode compartment was filled with a saturated NaCl solution. A voltage of 3.25 V was applied, which triggered the following electrochemical reactions at the cathode and anode.
Cathode
CO2 + H2O + e− → HCO3− + 1/2H2↑
H3PO4 + HCO3− → xH2PO4− + 2(1–x) HPO42− + H2CO3
H2PO4− + e− → HPO42− + 1/2H2↑
Anode
Cl− − e− → 1/2Cl2↑
During the electrical pumping membrane process, hydrogen was continuously generated from the cathode through reactions (R1) and (R2b), thereby driving the transport of lithium from the feed compartment through the LLTO membrane to be enriched in the cathode compartment. Simultaneously, chlorine gas was released from the anode compartment through reaction (R3) (Fig. S6, ESI†), since it does not dissolve in a saturated NaCl solution, thereby driving the transport of Cl− and/or other anions (i.e., HCO3−, H2PO4−, HPO42−) from the feed to the anode compartment through the AEM membrane.
Lithium extraction test
Subsequently, we demonstrated the enrichment of lithium from real seawater over 5 stages to give a level of ∼9000 ppm. In the first stage, Red Sea water (fetched from location 22° 18.38′ N, 038° 53.12′ E) was used as the feed solution and deionized water was used as the initial cathode solution. In the 2nd to 5th stages, the enriched lithium solution from the previous stage was used as the feed solution and the initial cathode stream. The operation time of each stage was fixed at 20 h. Such an arrangement allows the design of a membrane cascade as illustrated in Fig. S7 (ESI†) to achieve the lithium enrichment in a compact membrane assembly. Table 1 lists the concentrations of the major ions in seawater after each stage. With the exception of lithium, which was continuously enriched from the seawater level (0.21 ppm) to ∼9000 ppm, all other ions exhibited significantly reduced concentrations and remained almost constant after the 2nd stage. The membrane had a Li/Mg selectivity of 45 916 and a Li/Na selectivity of 16 277 in the first stage. While after the 5th stage, a Li/Mg ratio of 6090 and a nominal Li/Mg selectivity of more than 45 million were achieved.
From the data presented in Fig. 2a, the steady-state current was further plotted vs. the lithium feed concentration (Fig. 2b). As shown, the current increased with the feed concentration in an approximately proportional manner during the 2nd to 5th stages, but was exceptionally low in the 1st stage, thereby indicating that transport through the membrane was limited by the available lithium in the feed. The first stage is thus the rate-determining stage of the entire process, but its extraction rate, that is determined to be 13.43 mg (ppm dm−2 h−1)−1, still far surpasses the rate of traditional absorption process and electrodialysis process, as shown in Table S1 (ESI).†Fig. 2c shows the number of ions passing through the membrane at each stage. The amount of Li+ increases from the 1st to the 5th stage, which confirms the increasing transport rate upon increasing the feed concentration. In terms of the other ions, only in the first stage was there a substantial amount of Na+ passing through the membrane (i.e., ∼300 ppm). This is inevitable due to the fact that the ratio of Li/Na in seawater is so low that some Na+ can compete with Li+ to enter the LLTO lattice.4,23 However, in the remainder of the stages, all interference ions were almost completely blocked. Moreover, the total faradaic efficiencies of all stages were close to 100% (Fig. 2d). In the first stage, ∼47.06% of electrical energy was used to transport lithium, while in the remainder of the stages, ∼100% of electrical energy was used for lithium migration. Based on these data, we estimated the total electricity required to enrich 1 kg lithium from seawater to 9000 ppm in five stages to be 76.34 kW h. Simultaneously, 0.87 kg H2 and 31.12 kg Cl2 were collected from the cathode and the anode, respectively. Taking the US electricity price of US$ 0.065 per kW h into consideration, the total electricity cost for this process is approximately US$ 5.0. In addition, based on the 2020 prices of hydrogen and Cl2 (i.e., US$ 2.5–8.0 per kg and US$ 0.15 per kg, respectively),34 the side-product value is approximately US$ 6.9–11.7, which can well compensate for the total energy cost. It should also be noted that the current Cl2 utilization capacity in the chlor-alkali industry is ∼80 Mtons y−1. Even in the case where all the world lithium capacity is produced from our extraction process, the amount of Cl2 produced will be <3 Mtons, and so will have very little effect on the total market. It is also noted that the total concentration of other salts after the first stage is less than 500 ppm, which implies that after lithium harvest, the remaining water can be treated as freshwater. Hence, the process also has a potential to integrate with seawater desalination to further enhance its economic viability.

Table 1 Concentrations of the major ions in present seawater and in the enriched lithium solution
Table 1 shows the current recorded at each stage over time, whereby it is apparent that the current remains relatively stable after a sharp surge in the initial stage, which is due to the adsorption of ions onto the electrode and the membrane. Only in stage 5 did the current decrease slightly over time. As mentioned above, the feed concentration was maintained relatively constant during the entire process, but the concentration at the cathode stream was increased continuously. Hence, the stable current in the first four stages indicates that at low concentrations, the ion transport rate is mainly determined by the feed concentration rather than the concentration difference across the membrane.
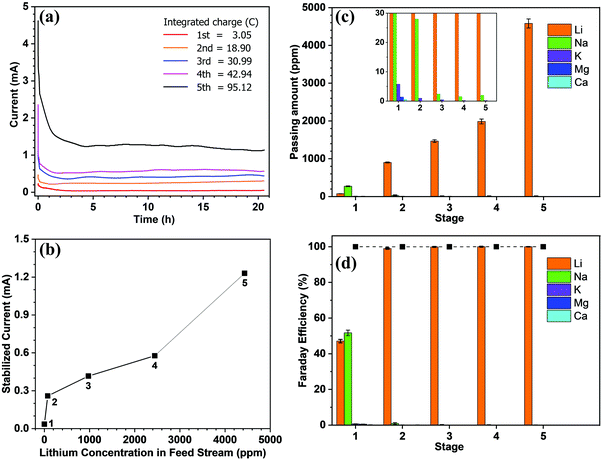
Fig. 2 Lithium extraction from seawater using the continuous electrical pumping membrane setup (effective membrane area = 2.01 cm2, voltage = 3.25 V): (a) the chronoamperometric curve at each stage; integrating the area under the curve gives the total charge passing through the membrane in Coulombs for each stage; (b) the steady-state current vs. the lithium feed concentration at different stages; (c) the amount of different ions passing through the membrane during each stage; the inset shows the plots at low range to help view the results of the interfering ions; (d) the contributed faradaic efficiencies of the different ions for each stage. The solid squares indicate the total faradaic efficiencies at the various stages.
It is further noted that the total energy consumption is proportional to the number of stages. However, the stable current curve shown in Fig. 2a implies that extending the processing time at each stage will render it possible to enrich the lithium concentration to a greater extent, and thereby reduce the number of stages (Fig. S8, ESI†). However, this will be conducted at the penalty of a low production rate. The exceptionally slow transport rate in the first stage (Fig. 2b) indicates that the lithium enrichment in the first stage will be a crucial design parameter in optimizing the energy-productivity trade-off. In this study, the duration of the first stage was determined based on the product purity, which requires the Mg concentration to be <2.0 ppm.35,36 Hence, the first stage was stopped when the Mg2+concentration reached ∼1.5 ppm, as shown in Table 1. Under these conditions, the lithium concentration reached ∼75 ppm.
Lithium product
Lithium can be readily precipitated out in the form of Li3PO4from the 5th stage enrichment stream by adjusting the pH to 12.25 using a 2.0 M NaOH solution (Fig. S9, ESI†). The sediment was separated by centrifugation, rinsed using deionized water, and then dried under vacuum. The collected white powder (Fig. 3a) was characterized by X-ray powder diffraction (XRD,Fig. 3b) spectroscopy, whereby the XRD pattern fit well with the standard pattern of Li3PO4(PDF#25-1030) without any impurity signals being detected. Further quantitative elemental analyses showed that the purity of Li3PO4was 99.94 ± 0.03%, and the weight percentages of Na, K, Mg, and Ca in the product were 194.53 ± 7.80, 0.99 ± 0.02, 25.16 ± 0.83, and 17.18 ± 0.57 ppm, respectively, which meet the requirements of lithium battery-grade purity (China standard, YS/T582-2013).35,36In addition, Fig. S10 (ESI†) showed that the product precipitated from the 4th stage could also meet the purity requirement, but could not be achieved from the 3rd stage.
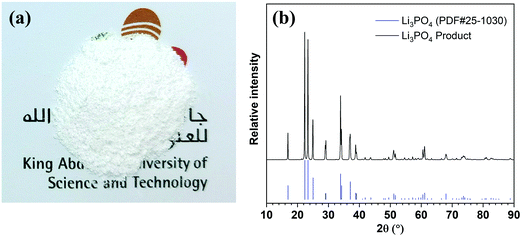
Fig. 3 The Li3PO4 product precipitated from the 5th enrichment solution. (a) A photographic image of the collected powder. (b) The XRD pattern of the collected powder. All diffraction peaks of the product matched with the standard Li3PO4 XRD pattern.
Conclusions
We herein reported the design of a continuous electrical pumping membrane process, which successfully enriched lithium from seawater samples of the Red Sea. The success of our process depends on a number of prominent features. Firstly, the thin and dense glass-type Li0.33La0.57TiO3 (LLTO) membrane provides efficient separation between lithium and other interfering ions, in addition to a high lithium permeation rate. Secondly, the separation of the anode compartment from the feed compartment by an anion exchange membrane and the use of a saturated NaCl solution in the anode compartment allow the release of Cl2. This is necessary to prevent the dissolution of the highly soluble Cl2 in the large volume of feed stream. Thirdly, the use of a CO2 and phosphate buffer solution stabilizes the pH and prolongs the lifetime of the membrane. Indeed, it was found that the LLTO membrane could be used for >2000 h with a negligible decay in performance. Finally, the use of a metallic copper hollow fiber enhanced the faradaic efficiency to ∼100% in all stages. The combination of enrichment with the conventional precipitation method makes the process less sensitive to the interference of soluble ions. The energy consumption is greatly reduced. Cost analysis showed that the value of the by-product could well overcome the energy cost. Although a rigorous economic analysis will be still necessary to include other capital and operating expenses, it is arguable that the energy cost is the major expenditure in this process. Furthermore, the process possesses further potential for optimization, and for its combination with seawater desalination to create innovative designs under the energy-water nexus scheme, which will further improve the process profitability. Hence, it is expected that our approach will lead to the development of a promising process to secure the supply of lithium for future energy uses.
Experimental
Fabrication of LLTO membranes
LLTO nanoparticles were prepared using a sol–gel process. LiNO3 (Sigma-Aldrich, USA, 99.99%) and La(NO3)3 (Sigma-Aldrich, USA, 99.999%) were dissolved in 25% aqueous citric acid (Sigma-Aldrich, USA, 99.0%). Subsequently, titanium(iv) butoxide (Sigma-Aldrich, USA, 97.0%) was added dropwise to the mixture under intense stirring (1000 rpm) and then heated to 100 °C to obtain a homogenous solution. The mole ratio of LiNO3, La(NO3)3, titanium(iv) butoxide and citric acid in the final solution was 0.363 : 0.57 : 1.00 : 6.53. The solution was dried under continuous stirring at 150 °C. The obtained solid was sintered at 600 °C for 4 h and then at 1050 °C for 20 h under air with both heating and cooling rates of 2 °C min−1. The resulting white LLTO powder was ball-milled at 300 rpm for 12 h to obtain nanoparticles of ∼200 nm in diameter (Fig. S1, ESI†). After ball-milling, the LLTO nanoparticles were loaded into a tungsten carbide (WC) pellet mold and pressed into disks to form the green bodies of the membranes with a diameter of 22 mm and a thickness of 70 μm. No binder is needed. The green bodies were sintered in a high temperature furnace first at 1050 °C for 4 h to release CO2 and NOx, and then at 1275 °C for 8 h in order to reach a molten state to form glass-type dense LLTO membranes. The heating and cooling rates of the sintering process were set to 2 °C min−1. During the sintering process, about 10% LiNO3 was vaporized. Hence, the final chemical formula of the LLTO membrane was Li0.33La0.57TiO3 determined from the ICP elemental analysis. The LLTO membrane has a perovskite crystal structure that is confirmed by XRD.
Preparation of the copper hollow fiber electrodes
The copper hollow fibers were prepared through a nonsolvent induced phase separation method followed by a high temperature sintering process.26 Copper powder (99%, ∼1 μm particle size, Shanghai Xianxin New Material Tech. Co., Ltd, China) was mixed with polysulfone (PSE, Ultrason E6020P, BASF, Germany), polyvinylpyrrolidone (MW ∼ 10 000, Alfa Aesar, USA), and N-methylpyrrolidone (NMP, 99.5%, Alfa Aesar, USA) at a weight ratio of 64.4 : 6.2 : 1.5 : 27.9 to form a homogenous dope solution, which was then spun through a tube-in-orifice spinneret. The obtained hollow fibres were sintered at 600 °C for 3 h under air and then reduced in an atmosphere of hydrogen/argon (volume ratio = 2 : 8) at 650 °C for 6 h. The Pt/Ru catalyst (50% on Kejenblack, FuelCellStore, USA) was wetted with deionized water and then mixed with Nafion solution (12.5% in dimethylformamide, Sigma-Aldrich, USA) in weight ratio of 7 : 3. The Pt/Ru:Nafion mixture was sprayed on the copper hollow fibre surface at a level of 2.0 mg cm−2.
Process of lithium extraction
The Red Sea water sample was fetched from location 22° 18.38′ N, 038° 53.12′ E. The water sample was filtered by fine filter papers (Whatman® acid treated and low metal grade, Sigma-Aldrich, USA) and then used without further treatment. The LLTO membrane and the AEM membrane (Fumasep FAA-3-20, FuelCellStore, USA) were assembled into the electrical cell and sealed using an O-ring. The solution volume circulated in the feed was 25 L for the first stage, and 2.5 L for the remainder of the stages. For all stages, the solution volumes at the cathode and anode compartments were fixed at 1.5 and 25 mL, respectively. A catalytic Pt–Ru carbonic cloth gas diffusion electrode (FuelCellStore, USA) was used as the anode, and the Pt–Ru-coated copper hollow fiber was used as the cathode. The copper hollow fibre was connected to a CO2 gas cylinder at a controlled flow rate of 6.0 mL min−1. Concentrated H3PO4 was further used as an auxiliary solution to control the pH of the cathode compartment between 4.5 and 5.5. The released Cl2 was adsorbed by CH2Cl2 to avoid contamination of the air, while hydrogen was collected using a gas sampling bag. A constant voltage of 3.25 V was applied through a Tektronix© 2450-EC potentiostat.

where CLi,5th, CMg,5th, CLi,sw and CMg,sw, are the mole concentrations of Li+ and Mg2+ in the 5th enriched stream and seawater, respectively.
We also calculated the Li/Mg selectivity (SLi/Mg) and Li/Na selectivity (SLi/Na) of the first stage by the following equation,

where CLi,1st, CMg,1st, CLi,sw, CMg,sw, CNa,1st, and CNa,sw, are the mole concentrations of Li+, Mg2+ and Na+ in the 1st enriched stream and seawater, respectively.

The first stage is the rate-determining stage of the entire process, and the extraction rate of the first stages was calculated by the following equation:

where mLi is the mass of Li+ passing through the LLTO membrane at the first stage; t is the operation time of the first stage; A is the membrane area; and Csw is the concentration of Li+in seawater.
Characterization
SEM (FEI© Magellan) with a beam energy of 5 kV was used for imaging the samples coated with a 5 nm-thick Ir film. XRD (Bruker© D8 twin) was carried out using Cu Kα radiation at 5.0–90.0° with a scan rate of 0.01° per second. ICP-OES was carried out using a PerkinElmer© Optima 8300 instrument. Liquid samples for ICP-OES were diluted with a 1% aqueous nitric acid where necessary, while solid samples were initially dissolved in a small amount of a 70% aqueous nitric acid solution using a microwave digester and then diluted to the required concentration range using a 1% aqueous nitric acid solution.
Calculation of the energy consumption and the faradaic efficiency
The chronoamperometric curves shown in Fig. 2a were integrated over time to obtain the total charge, Qj, for each stage j. Multiplying the total charge with the applied voltage, 3.25 V, gave the total energy consumption, Ej, for each stage.
The faradaic efficiency was calculated by the following equation,where mi,j is the ion concentration obtained from Table 1 for ion i at stage j, zi is the valence state of ion i, F is the Faraday constant, Vj is the total circulation volume of the cathode stream (i.e. 1.5 mL), Mi is the molecular weight of ion i, and Ej is the total energy consumption at stage j.

Author contributions
Z. Lai and Z. Li conceived the idea and took the lead in writing the manuscript. Z. Li conducted the lithium enrichment experiments. C. Li synthesized the LLTO membranes. X. Liu performed the ICP measurements. L. Cao and D. Guo carried out the electrochemical testing. P. Li and X. Li acquired the SEM images. R. Wei built the lithium enrichment setup. K.-W. Huang and all other authors provided critical feedback and helped shape the research, analysis, and manuscript. Z. Lai supervised the project.
Conflicts of interest
All authors declare no competing interests.
Acknowledgements
This work was financially supported by the KAUST baseline fund BAS/1/1375-01 and the KAUST competitive research fund URF/1/3769-01.
References
1. B. Swain Sep. Purif. Technol., 2017, 172 , 388 —403 Search PubMed .
2. C. Grosjean , P. H. Miranda , M. Perrin and P. Poggi , Renewable Sustainable Energy Rev., 2012, 16 , 1735 —1744 Search PubMed .
3. S. Yang , F. Zhang , H. Ding , P. He and H. Zhou , Joule, 2018, 2 , 1648 —1651 Search PubMed.
4. C. Liu , Y. Li , D. Lin , P.-C. Hsu , B. Liu , G. Yan , T. Wu , Y. Cui and S. Chu , Joule, 2020, 4 , 1459 —1469 Search PubMed .
5. M. Diallo , M. Kotte and M. Cho , Environ. Sci. Technol., 2015, 49 , 9390 Search PubMed .
6. Z. Zhao , X. Si , X. Liu , L. He and X. Liang , Hydrometallurgy, 2013, 133 , 75 —83Search PubMed .
7. H.-J. Hong , T. Ryu , I.-S. Park , M. Kim , J. Shin , B.-G. Kim and K.-S. Chung , Chem. Eng. J., 2018, 337 , 455 —461 Search PubMed .
8. L. Tang , S. Huang , Y. Wang , D. Liang , Y. Li , J. Li , Y. Wang , Y. Xie and W. Wang , ACS Appl. Mater. Interfaces, 2020, 12 , 9775 —9781 Search PubMed .
9. T. Ryu , A. Rengaraj , Y. Haldorai , J. Shin , S. R. Choe , G.-W. Lee , S.-K. Hwang , Y.-K. Han , B.-G. Kim and Y. S. Huh , Solid State Ionics, 2017, 308 , 77 —83 Search PubMed .
10. Y. Han , S. Kim , S. Yu , N. V. Myung and H. Kim , J. Ind. Eng. Chem., 2020, 81 , 115 —123Search PubMed .
11. Y. S. Kurniawan , R. R. Sathuluri , K. Ohto , W. Iwasaki , H. Kawakita , S. Morisada and M. Miyazaki , Sep. Purif. Technol., 2019, 211 , 925 —934 Search PubMed .
12. M. Yazdanpanah , M. M. Zahedi and M. Ziyaadini , Anal. Methods, 2019, 11 , 2720 —2725Search PubMed .
13. R. E. C. Torrejos , G. M. Nisola , H. S. Song , J. W. Han , C. P. Lawagon , J. G. Seo , S. Koo , H. Kim and W.-J. Chung , Hydrometallurgy, 2016, 164 , 362 —371 Search PubMed .
14. Q. Zhu , X. Ma , H. Pei , J. Li , F. Yan , Z. Cui , H. Wang and J. Li , Sep. Purif. Technol., 2020, 116940 Search PubMed .
15. T. Hoshino Desalination, 2015, 359 , 59 —63 Search PubMed .
16. T. Hoshino Desalination, 2013, 317 , 11 —16 Search PubMed .
17. T. Hoshino Fusion Eng. Des., 2013, 88 , 2956 —2959 Search PubMed .
18. D. S. Sholl and R. P. Lively , Nature, 2016, 532 , 435 —437 Search PubMed .
19. P. Ball Membr. Technol., 2000, 2000 , 10 —13 Search PubMed .
20. M. R. I.Amat, PhD thesis, Universitat Politècnica de Catalunya, 2017.
21. G. Bernardo , T. Araújo , T. da Silva Lopes , J. Sousa and A. Mendes , Int. J. Hydrogen Energy, 2020, 45 , 7313 —7338 Search PubMed .
22. L. Schorer , S. Schmitz and A. Weber , Int. J. Hydrogen Energy, 2019, 44 , 12708 —12714Search PubMed .
23. F. Zhang , S. Yang , Y. Du , C. Li , J. Bao , P. He and H. Zhou , Chem. Commun., 2020, 56 , 6396 —6399 Search PubMed .
24. X. Zhao , H. Zhang , Y. Yuan , Y. Ren and N. Wang , Chem. Commun., 2020, 56 , 1577 —1580Search PubMed .
25. Y. Inaguma and M. Nakashima , J. Power Sources, 2013, 228 , 250 —255 Search PubMed .
26. X. Li , J. Liang , X. Yang , K. R. Adair , C. Wang , F. Zhao and X. Sun , Energy Environ. Sci., 2020, 13 , 1429 —1461 Search PubMed .
27. C. Ma , C. Liang , K. More , C. Nan and M. Chi , Energy Environ. Sci., 2014, 7 , 1638 —1642Search PubMed .
28. J. Bae , Y. Li , J. Zhang , X. Zhou , F. Zhao , Y. Shi , J. B. Goodenough and G. Yu , Angew. Chem., Int. Ed., 2018, 57 , 2096 —2100 Search PubMed .
29. Y. Sun , P. Guan , Y. Liu , H. Xu , S. Li and D. Chu , Crit. Rev. Solid State Mater. Sci., 2019, 44 , 265 —282 Search PubMed .
30. Y. Inaguma , J. Yu , Y. J. Shan , M. Itoh and T. Nakamuraa , J. Electrochem. Soc., 1995, 142 , L8 —L11 Search PubMed .
31. H. Kawai and J. Kuwano , J. Electrochem. Soc., 1994, 141 , L78 —L79 Search PubMed .
32. B. Wang and Z. Lai , J. Membr. Sci., 2012, 405-406 , 275 —283 Search PubMed .
33. R. Kas , K. K. Hummadi , R. Kortlever , P. de Wit , A. Milbrat , M. W. J. Luiten-Olieman , N. E. Benes , M. T. M. Koper and G. Mul , Nat. Commun., 2016, 7 , 10748 Search PubMed .
34. O. J. Guerra , J. Eichman , J. Kurtz and B.-M. Hodge , Joule, 2019, 3 , 2425 —2443Search PubMed .
35. K. He , Z.-Y. Zhang , L. Alai and F.-S. Zhang , J. Hazard. Mater., 2019, 375 , 43 —51Search PubMed .
36. W. Liu , G.-W. Chu , S.-C. Li , S. Bai , Y. Luo , B.-C. Sun and J.-F. Chen , Chem. Eng. J., 2019, 377 , 119929 Search PubMed .
I believe the results shown in the paper are accurate and could lead to a cheap infinite supply of lithium. This will help production of Electric Vehicles (EVs), but as I mentioned two weeks ago (May 17th Notes) artificial intelligence will significantly reduce the number of EVs and largely eliminate a major lithium shortage.
Thanks for Reading,
Dana Andrews
retiredrocketdoc.com