Global Warming – The Big Picture Part 1.
As we have discussed previously Global Warming is the gradual increase in the average world temperature caused by the increase in greenhouse gases generated by powerplants, transportation systems, industrial processes, farm animals, and heating plants worldwide. The current temperature increases of a little over 1.0 C. since 1880 is shown is figure 1 below.
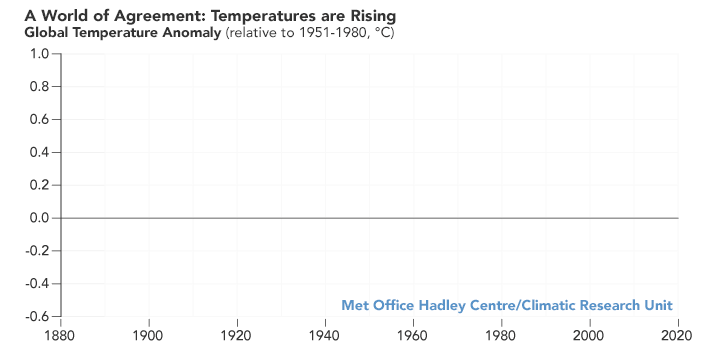
Figure 1 – World Temperature Rising over Time
It is obvious that the rate of temperature increase is accelerating over the last 50 years, and this is reflected in the rate of world CO2 emissions during the same period as shown in figure 2 below.

Figure 2 – CO2 Emissions / year
The accelerating carbon emissions are driven by the desire of populations to increase their standard of living, or Gross National Product (GDP), as shown in figure 3 below.

Figure 3 – Energy Use versus Nations Per Capita income
From the above data you can see that prosperous nations use more energy, and there are not many outliers. Much of the infrastruture that defines a high standard of living requires abundant energy. Many developing countries want to increase their standard of living and they are building powerplants as fast as possible using whatever powerplants and energy sources they can afford. Often this is coal and this is a key factor in our current problem. See the global Carbon Emissions by Source in figure 4 below.

Figure 4 – Global CO2 Emissions by Source
As you can see the problem is rapidly becoming worse and up until recently coal has been the fossil fuel of choice. The key to breaking this cycle is advancing technology as we see below
.
Power companies are very aware of global warming, but they must keep the costs of electricity affordable or they will be out of business. Fortunately for them, and for us, widespread fracking (a new technology) has increased the supply of natural gas and reduced its cost so that combined-cycle (gas- turbine plus steam-turbine) powerplants are not only more efficient than coal-fired plants but cheaper also. The additional advantage is that compared to the average air emissions from coal-fired generation, a combined-cycle natural gas plant produces half as much carbon dioxide, less than a third as much nitrogen oxides, and one percent as much sulfur-oxides as the coal-fired power-plant. Let’s look at the long-term effects of energy cost next.

Figure 5 – Predicted Energy Cost and Long-Range Capacity Projections
(Source-U.S. Energy Information Administration)
The levelized cost of electricity (LCOE) represents the cost to build and operate a power plant, converted to a level stream of payments over the plant’s assumed financial lifetime. Installed capital costs include construction costs and financing costs. Operating costs include fuel costs (for power plants that consume fuel) and expected maintenance costs. LCOEs may also include other applicable tax credits or subsidies.
The levelized avoided cost of electricity (LACE) accounts for the differences in the grid services each generating technology is providing (a power plant’s value) to the grid. For example, natural gas combined-cycle plants and coal plants provide dispatchable baseload services to the grid and thus have similar LACE values, even if their LCOE values differ. A generator’s avoided cost provides a proxy for the potential revenues from sales of electricity generated. As with LCOE, these revenues are converted to a level stream of payments over the plant’s assumed financial lifetime.
The ratio of these two measures serves as a value-to-cost ratio. Power plants are considered economically attractive when their projected LACE exceeds their projected LCOE, meaning their value-cost ratio exceeds one.
The relative costs and values of several technology options are calculated for each of the 22 electricity regions in the modeling system used to inform EIA’s Annual Energy Outlook. Calculations start in 2021 because that is the first feasible year that all three technologies are available to come online in the model, given the assumed construction lead-time and licensing requirements.
EIA’s long-term projections show that most of the electricity generating capacity additions installed in the United States through 2050 will be combined-cycle natural gas, and solar photovoltaic (PV). Onshore wind looks to be competitive in only a few regions before the legislated phase-out of the production tax credit (PTC), but it becomes competitive later in the projection period as demand increases and the cost for installing wind turbines continues to decline.
The portion of the world with abundant natural gas is making similar decisions. The portions of the world without natural gas resources are still building coal and oil fired powerplants to supplement their photovoltaics. The bottom line here is that all countries will be continuing to emit major amounts of CO2 well past the 2050 date, and this will continue despite political efforts to increase the cost of fossil fuels (the natural gas combined cycle powerplants are either under construction or in advanced planning).
Here’s where I tell you what I would do if I were in charge. There are two different areas I would emphasize. First, we need a clean alternative to natural gas. I would go nuclear, first small fission plants, followed by small fusion powerplants. I had hoped our government would step up to the challenge, like the Chinese and Indian governments have, but I fear that train has left the station. We are going to have to rely on the private equity investors I have named in previous blogs. I give us about a 50-50 chance of having suitable demonstration nuclear powerplants available within the next ten years. If that happens there will be no more natural gas powerplants built in the U.S. after 2050.
The second thing I would do is start to seriously test methods to increase the Earth’s albedo and reduce average temperatures. I would do this because if you look at the current increases in CO2 in the Earth’s atmosphere and look where it is coming from (figure 6 below), there is no way in hell we are going to able to reduce emissions to the point where we can keep the worlds CO2 below 600 ppm by 2100. With no changes to the Earth’s albedo (reflectivity) I predict a world average temperature increase of about 2.5 degrees Celsius with a four-foot rise in sea-level. I will go into more detail in my next blog. It’s been a good Labor Day Weekend and I need to get back to working around the house.

Figure 6 – Hardest CO2 Emissions to Eliminate.